

Diagrams
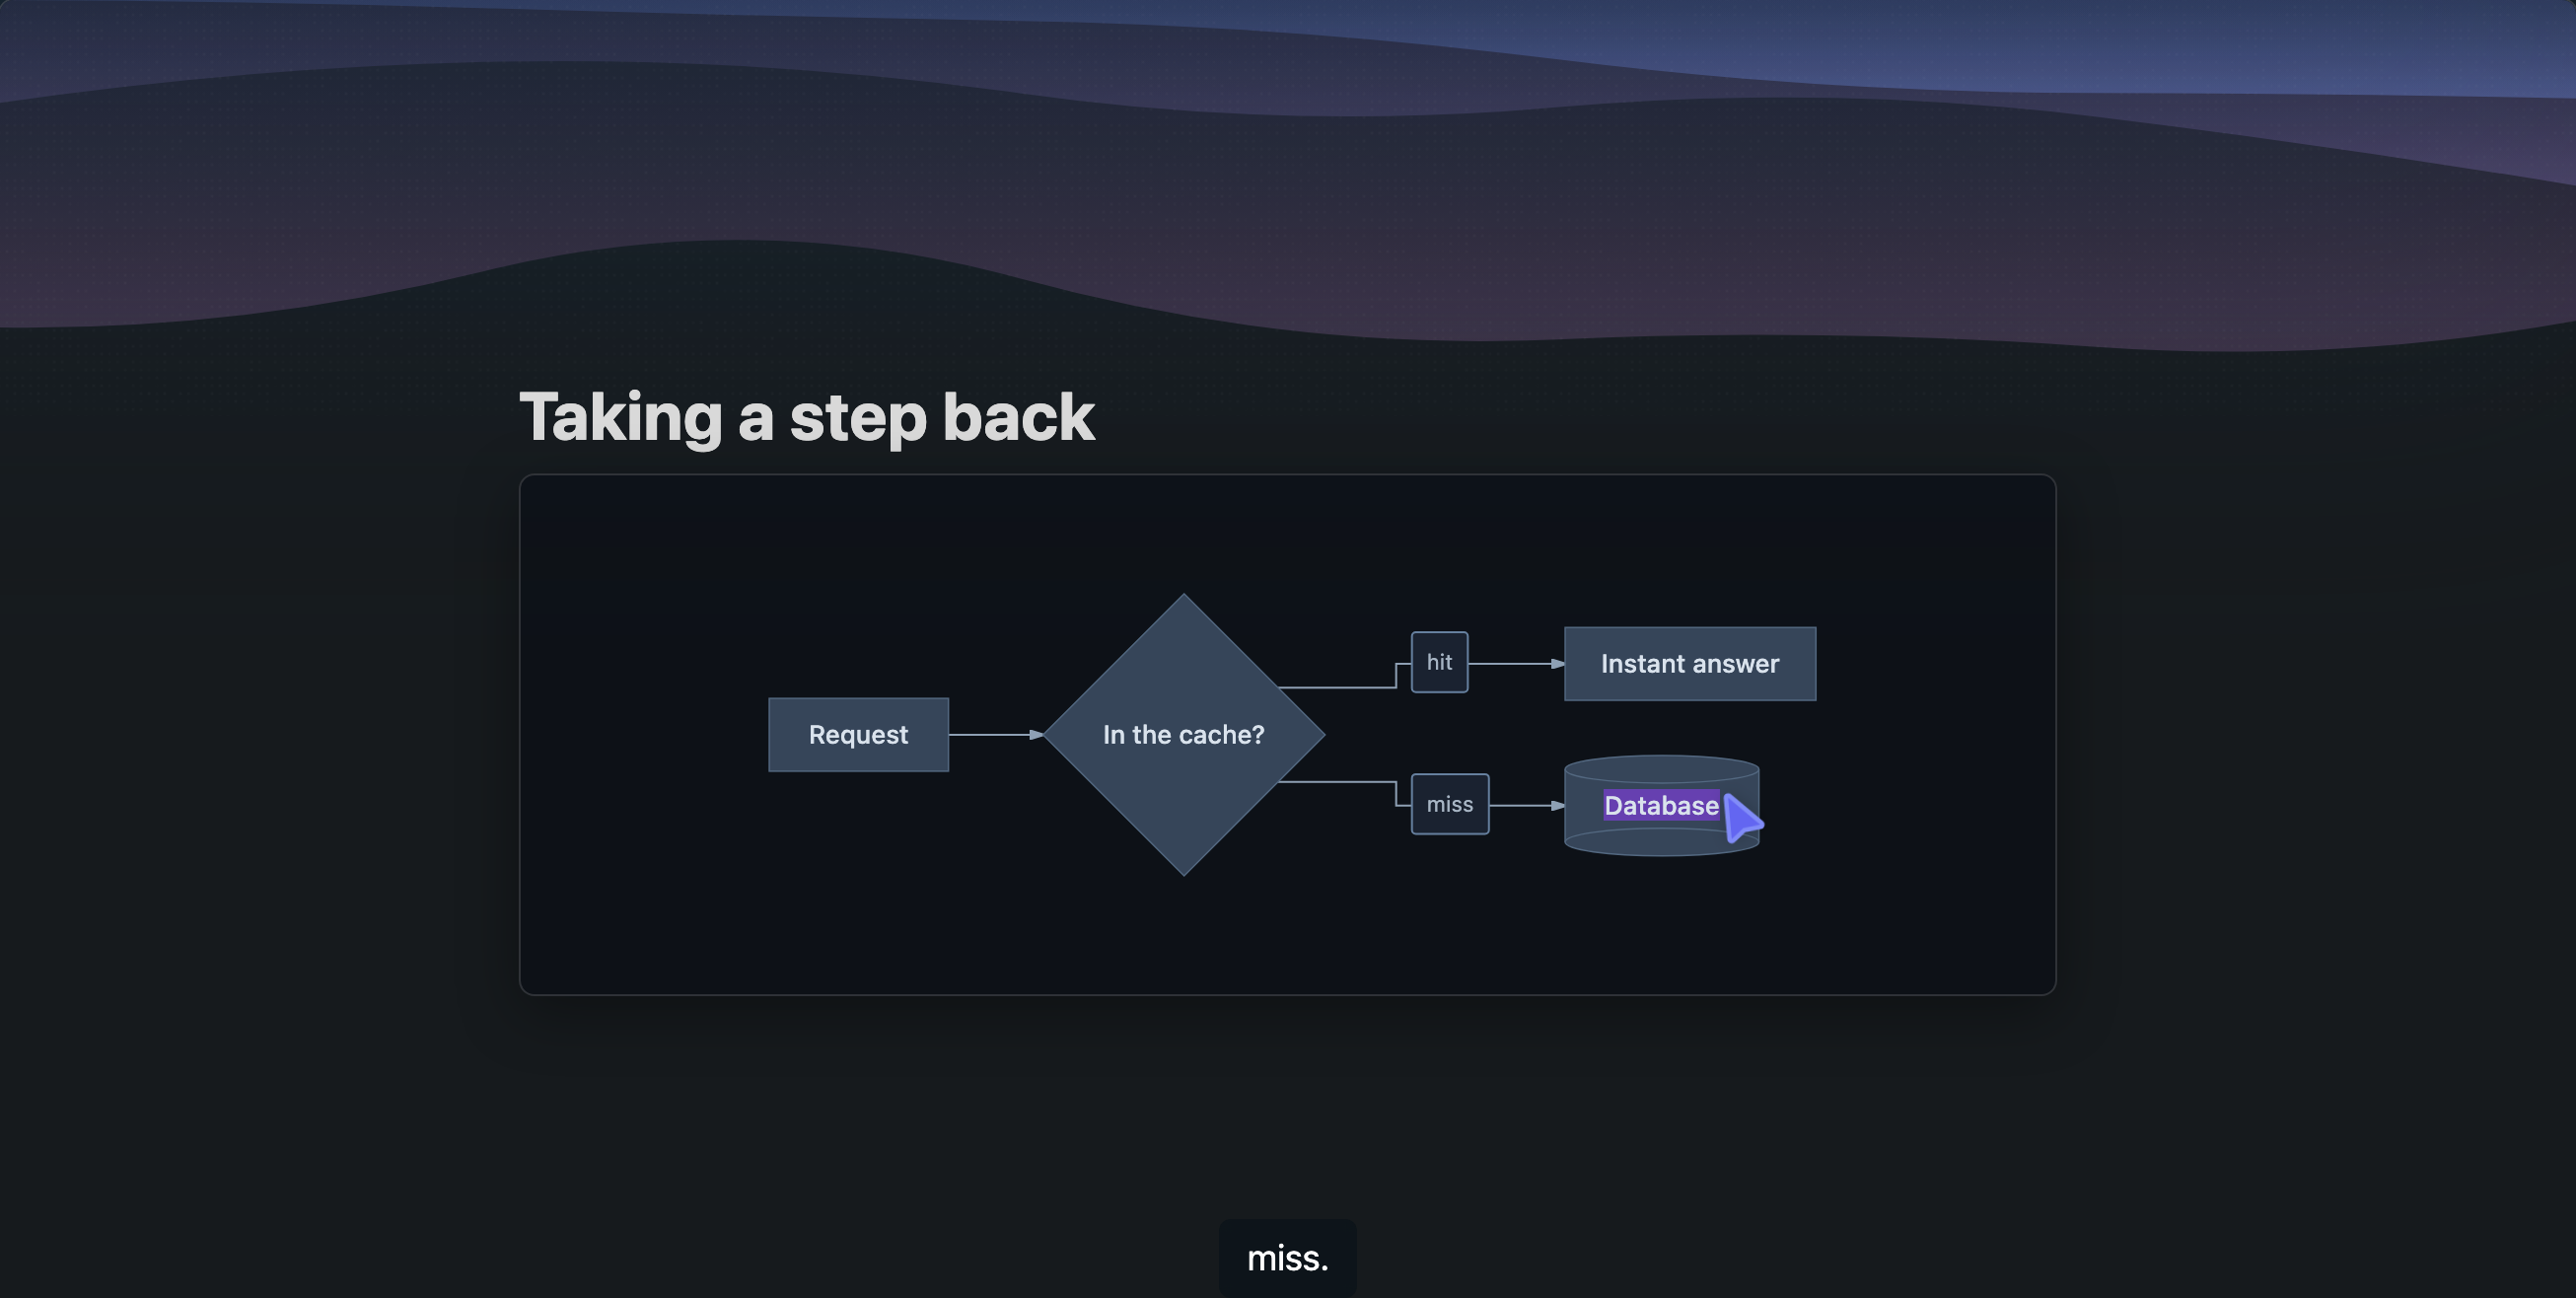
When the topic is how things connect, the slide is a diagram. Explain picks the kind that fits:
- Flowcharts for branching logic and architecture: the check that can fail, the cache hit versus the miss, the loop back
- Sequence diagrams for parties exchanging messages: browser to server to database, request and response, handshakes
- State diagrams for one thing moving through named states: a connection, a request lifecycle, a UI mode
The narration walks the diagram in order, with the pointer landing on each node, arrow, and label as it's mentioned.
Diagrams show structure that stands still. For things that move or change over time, the lesson uses an animation instead, and for a topic that splits into four parts worth seeing side by side, an infographic.
Getting good diagram slides
Mention the flow you care about: with a diagram of the request flow or show the states a connection goes through steers the explainer toward the right picture.